Data
Undergraduate students generate vast amounts of behavioral data every day through various university systems. This student behavior data can be analyzed to assess academic performance, study habits, and other lifestyle habits. The data examined in this study comes from the campus system database of a university in Northeast China, which records students’ basic information, academic performance, as well as detailed data on daily transactions and library visit logs. This study extracted four types of data from the campus system database of the university. First, the basic student information includes each student’s name, gender, student ID, college, major, enrollment year, hometown, and ethnicity. Second, academic performance data consists of course names, grades, and rank. Third, lifestyle transaction data includes categories of spending, locations, service counters, payment methods, timestamps, transaction amounts, remaining balances, and recharge amounts. The spending categories encompass dining in cafeterias and bathing expenses. Fourth, the library access logs provide accurate entry and exit times, as well as visit frequencies. Data use complies with privacy requirements and standards, and data involving students has been desensitized. All data were preprocessed to remove duplicate records and standardize the formatting. Students’ academic performance data were also normalized to account for score variations across disciplines and majors.
The dataset used in this study contains 3,123,840 records of on-campus behavioral data from 3,499 undergraduate students collected between 2018 and 2022. Roughly 78% of the students were men, and the remaining 22% were women. This study was conducted within the College of Engineering, where students’ gender ratio is markedly imbalanced. The research sample consisted of 1676 students aged 22 and 1445 students aged 23 (48% and 41% of the dataset, respectively). A subset of 398 undergraduates represented ethnic minorities, constituting 11% of the sample. Most students (71%) were members of the Communist Party of China (CPC). The average grade point average (GPA) was 80.095 points, with a standard deviation of 9.373. This distribution closely resembled a normal one in that it mirrored college students’ actual academic performance patterns. This sample therefore possessed a reasonable structure, approximated real-world proportions, and was highly representative. Additionally, the dataset corresponds to the campus closures following the outbreak of COVID-19 in January 2020. During this period, universities in China strictly controlled access to campus and prohibited outside food deliveries. The data on eating in cafeterias, bathing, and studying in the library largely reflect students’ on-campus behaviors with reduced external distractions. These factors collectively support the study’s credibility and reliability.
Measures
Academic performance (GPA) is a key metric of educational quality and a quantifiable outcome of students’ achievement. This measure normally refers to GPA in higher education settings, which is calculated by weighting the grades of individual courses according to their credit hours (Wang et al. 2015; Zeek et al. 2015).
This study refers several independent variables from Shu et al.’s (2020) dining model. Aspects of interest included students’ Mealtime stability coefficient, Early rising coefficient, Restaurant counter selection, Restaurant consumption level, and Restaurant consumption stability. These variables were used to define a range of eating habit indicators, facilitating a more systematic analysis of students’ consumption behavior. Several other factors (e.g., Average bathing frequency, Average bathing time, Average library arrival frequency, and Average study duration) were assessed based on their relative intensity in Applied Statistics. The specific calculations for all independent variables are shown in Table 1.
Control variables included Gender (woman = 1 and 0 otherwise), Ethnicity (Han = 1 and 0 otherwise), Age, and Political Affiliation (CPC membership = 1 and 0 otherwise). These characteristics were integrated to control for potential confounding factors that might affect academic performance. This approach ensured a more precise evaluation of how students’ lifestyle habits influence their academic achievement.
Model training
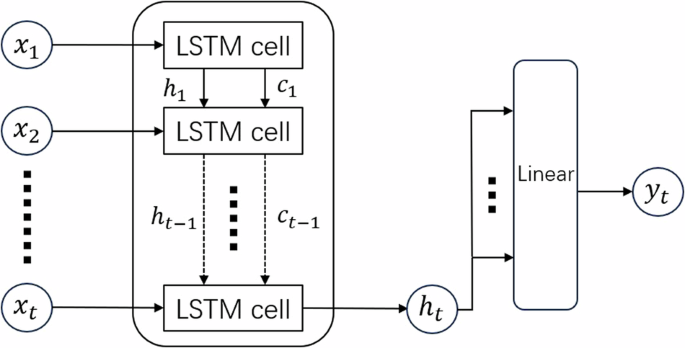
In this study, we use an LSTM (Long Short-Term Memory) model to process and compute indicators of students’ historical eating habits. The model is implemented in Python using a custom script based on the Torch library, a widely used framework for deep learning. The Torch library provides flexibility in designing and training custom LSTM models tailored to specific tasks. As a type of recurrent neural network (RNN) structure, LSTM is particularly well-suited for handling time series data. Compared with traditional RNN, the LSTM introduces input gates, forget gates, output gates, and a cell state, which enable LSTM to better handle long-term dependencies in sequences (Graves and Schmidhuber, 2005). The specific process is shown in Fig. 1.
At each time step t, the LSTM receives an input variable xt, which includes behavioral features like meal time and location at that moment. To make these features suitable for model processing, one-hot encoding is applied, representing various categories of times (breakfast, brunch, lunch, afternoon tea, dinner, and late-night snack) and meal locations as separate dimensions. As a result, the input variable’s dimension expands to 404, encompassing the categorical features for all time points. One-hot encoding is defined here as follows: typically, categorical features like meal locations might be represented by numbers (1 to n), yet since there is no inherent ordering or magnitude relationship between these categories, they are converted into one-hot encoded variables to separate them effectively. Each category is represented by an N-bit register, where only one bit is active at any point, which not only addresses the issue of implied ordering in categorical data but also enriches the feature space. This added dimensionality helps the model better differentiate distinct behavioral patterns.
The LSTM controls the flow of information through three internal gates—forget gate, input gate, and output gate—to effectively manage both long-term and short-term dependencies in a sequence. The forget gate determines which information from the previous hidden state \({h}_{t-1}\) should be retained or discarded, filtering historical information that is relevant to the current time step. The input gate receives the current input xt and decides what new information should be stored in the LSTM cell. Finally, the output gate generates the current hidden state ht based on the information within the cell and produces the model’s prediction yt at that time step.
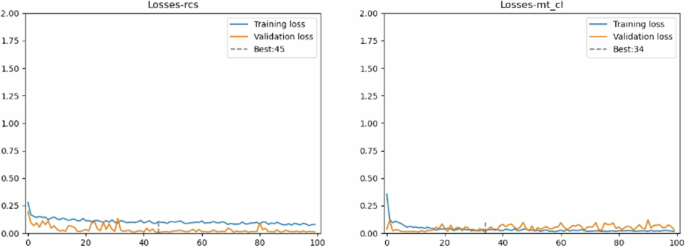
In supervised learning, the evaluation metric is known as the loss value, which quantifies the model’s error. In this study, the LSTM model was used to calculate the variables related to eating habits, and the training loss for selected variables is shown in Fig. 2. The training and validation loss of both models drop sharply at the beginning and then stabilize at lower levels. The optimal validation loss appears around the 45th and 34th iterations, indicating that the LSTM model has achieved a satisfactory performance at these points.
Analytic approach
A multiple regression model was created to test H1–H3 regarding undergraduate students’ lifestyle habits and associated effects on academic performance. The following regression equations applied:
$$\begin{array}{c}{Y}_{GPA}={\beta }_{0}+{\beta }_{1}{X}_{habit}+{\beta }_{2}Gender+{\beta }_{3}Ethnicity\\ \,+\,{\beta }_{4}Age+{\beta }_{5}PoliticalAffiliation+\varepsilon \end{array}$$
(1)
where YGPA is the student’s academic performance (GPA); Xhabit is the student’s eating habits, hygiene habits and studying habits; and Gender, Ethnicity, Age, Political Affiliation are control variables. ε is the random disturbance term; β1 denotes the parameters to be estimated. The regression analyses were implemented using custom code written with the Statsmodels library, a widely used Python module that facilitates the estimation and analysis of various statistical models.


